Business Intelligence
Contents
Enhance your Analytics with Business Intelligence
For a video tour of Business Intelligence, see the Business Intelligence Hub. Business Intelligence is an add-on advanced reporting tool. If you'd like this added to your account, reach out to your CSM.Retention Analytics to Business Intelligence Migration
With the migration from Retention Analytics to Business Intelligence, some naming conventions have changed.| Retention Analytics | Business Intelligence |
| Dashboard | Workbook |
| A tab within a dashboard | Dashboard |
| Single chart or report | Worksheet |
| Folder | Project |
From Marigold Engage by Sailthru to Business Intelligence
Business Intelligence is a Single Sign-On application. Navigate to Business Intelligence directly from the application with additional no log-in needed. To navigate to your Business Intelligence application:- Select the Analytics menu in the application.
- Select Dashboards.
- From the flyout menu, select Business Intelligence. This takes you to the Home screen.
Locate a Dashboard
Your Home screen shows your recently viewed items. These are the individual dashboards you've viewed.
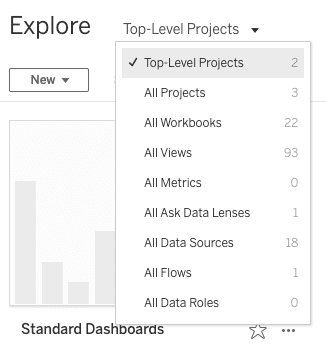
Access your Favorite reports, a full list of your Recent views, and any Collections of reports from the sidebar menu. The Explore screen shows your available reports as granularly as you would like to see them, from your top-level projects to a list of individual views. Top-level projects combine multiple dashboards into one folder.
Business Intelligence Dashboards
- From the Home tab, select a recently viewed dashboard to open it.
- From the Explore view, select an available Project. Once a project loads, select a dashboard. For the following examples, we'll look at the Executive Dashboard available in the Standard Dashboards project.
Download
Download a specific view or different sheets from the dashboard or workbook or the underlying data in one of the following formats: image, data, crosstab, PDF, or PowerPoint.- Select the Download
 button .
 - From the list, select your preferred download format.
- In the Download modal, set any download parameters, including which view or sheets you wish to download.
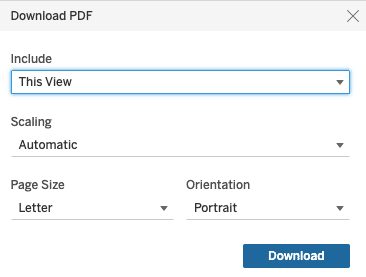
- Select Download to trigger the file download.
Watch Menu
Subscribe to specific views, track metrics from a view, or create an alert from the Watch menu.Subscribe to Views
Subscribe to specific views and never miss an update.- Identify which views for which you'd like updates.
- Note down the format you'd prefer (Image or PDF) and the frequency.
- Send the view or views, format, and frequency to Support and the subscriptions will be added for you.
Alerts
Receive an alert when data crosses a specific threshold.- Identify the chart for which you'd like an alert.
- Note the numeric axis for the chart.
- Note down the condition for your alert and the threshold.
- Select a cadence for alerts.
- Send all of these to Support and an Alert will be created for you.
Customize Views
Each report allows a certain amount of data manipulation. Any changes you make won't affect the underlying data in your report, it just changes the visualization for the time you're viewing it.Filters
Each dashboard allows data filtering, depending on how the data is presented, so you can see just the data you wish to see.
For example, these are the filters available in the Executive Dashboard.
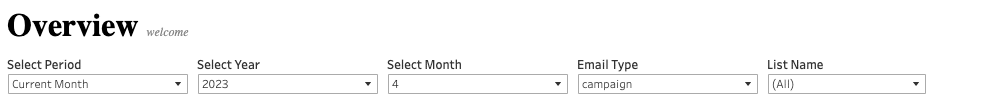 Select filters to reflect the data you wish to see.
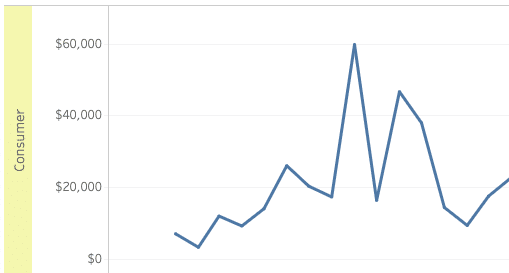
Dashboards that include charts allow for other filtering options, including data highlighting.
Select filters to reflect the data you wish to see.
Dashboards that include charts allow for other filtering options, including data highlighting.
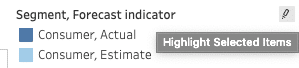
Select one of the charted values from the list, then select Highlight Selected Items when it appears. The chart highlights only the selected value:
Save a Custom Dashboard
To create and save a custom dashboard:- Open the dashboard you wish to work within.
- Apply any filters, change the data sorting, select specific data markers, etc.
- Select View: Original
 in the toolbar to open the Custom Views modal.
- Give your view a name and make it your default view or make it visible to others if you wish. A name is the only required option to save a custom view.
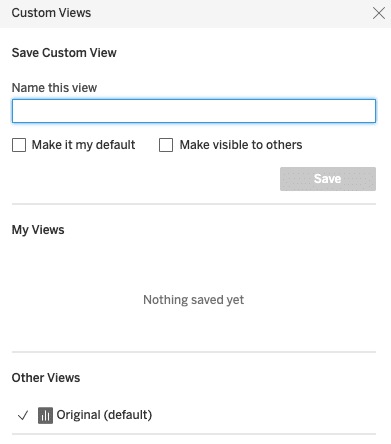
- Select Save to save your view.