SMS Summary
Contents
Visualize the engagement of your campaigns and triggered sends over time with SMS Summary.
Watch the video below to learn how to measure the success of your SMS campaigns.
Navigate to the SMS Summary report from the Analytics menu (Analytics > Summary > SMS Summary). The report includes three main areas:- Configurable headline metrics
- Filtering by date and message type
- Charts or tables showing your report data
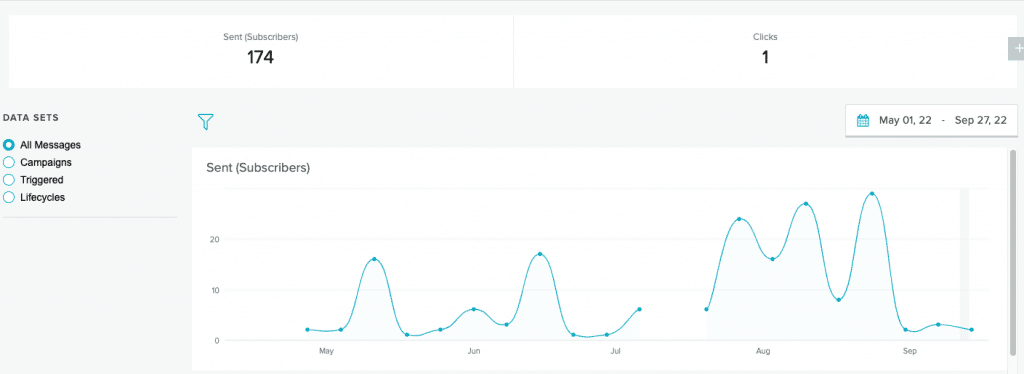
Available Data
By default, the SMS Summary report shows sends. The Summary view, which organizes data in line charts, reflects the metrics selected for the headline metrics row. The Table view, available for Campaign, Triggered, and Lifecycle Optimizer sends, shows all available data.| Name | Description |
|---|---|
| Sent (Subscribers) | The number of subscribers to whom the message was sent. |
| Clicks | The total number of clicks on the message link. This data is available if link shortening and tracking is used. |
| Purchases | The number of users who performed a purchase action on your properties, attributed to a Campaign or Triggered send. The Purchase API must be implemented for this metric to render a non-zero value. |
| Pageviews | The number of pageviews generated by clicks from a Campaign or Triggered send. The Javascript library generally needs to be implemented for this metric to show a non-zero value. |
| SMS Revenue | The total price of item(s) purchased by a user, where attributed to a send. The Purchase API must be implemented for this metric to show a non-zero value. |
| PV/M (pageviews per thousand) | The number of pageviews generated by clicks from a Campaign or Triggered send, per thousand. The Javascript library generally needs to be implemented for this metric to show a non-zero value. |
| Rev/M (revenue per thousand users) | The sum of purchase revenue generated by purchases from a Campaign or Triggered delivered count, per thousand users messaged. The Purchase API must be implemented for this metric to show a non-zero value. |
| Conversion Rate | The number of purchases divided by the number of clicks. |
| Template Name | The name of the template used in the flow. Available for Triggered message data and Lifecycle Optimizer flow data. |
| Flow Name | The name of the Lifecycle Optimizer flow. |
| Campaign Name | The name of the Campaign. |
| Send Date | The Campaign send date. Only available for Campaign data. |
| List Name | The name of the list used in the Campaign. Only available for Campaign data. |
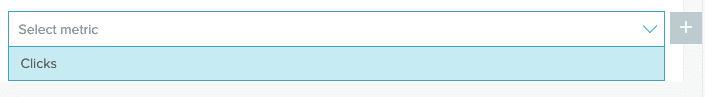
Add Metrics
To add metrics to the report:- Select the blue plus icon
 at the end of the headline metrics row.
 - From the dropdown menu, select what you wish to see in the headline row.
- Repeat the first two steps to add more data. If you add all available metrics, the plus icon at the end of the headline row turns gray.
Remove Metrics
To remove any metric from the headline row, hover over the top right corner of the box. Select the x in the corner of the box.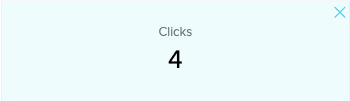
Filters
Filter messages by type and date.Filter by Message Type
Select the filter icon| Data Set | Definition | Group by Template | Table View |
|---|---|---|---|
| All Messages | Shows the selected metrics for all SMS messages. | No | No |
| Campaigns | Shows the selected metrics for all Campaign SMS messages. | No | Yes |
| Triggered | Shows the selected metrics for all Triggered SMS messages. | Yes | Yes |
| Lifecycles | Shows the selected metrics for all SMS messages in Lifecycle Optimizer flows. | Yes | Yes |
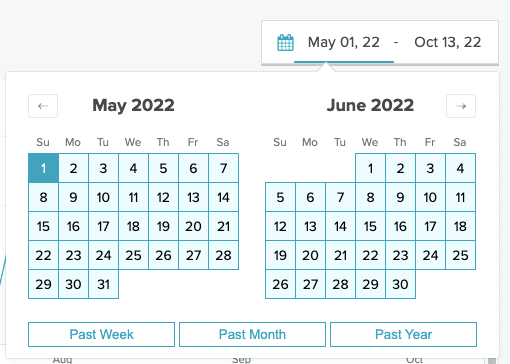
Filter by Date
Use the calendar dropdown to select a custom date range or use one of the preset ranges.