Content Summary
Contents
Understand how your customers engage with your content and tags over time with Content Summary. Located in the Analytics menu under Summary, this report will give you visibility into trends relating to your content engagement by comparing views, clicks from campaigns, revenue, and purchases year-over-year.
This report will also help you understand the ranking of your content and tags over a period of time, as well as what the highest performers were at a regular cadence such as daily, weekly, and monthly.The Report
View aggregate data of your content and tag performance. Locate the Content Summary report in the Analytics menu, under Summary.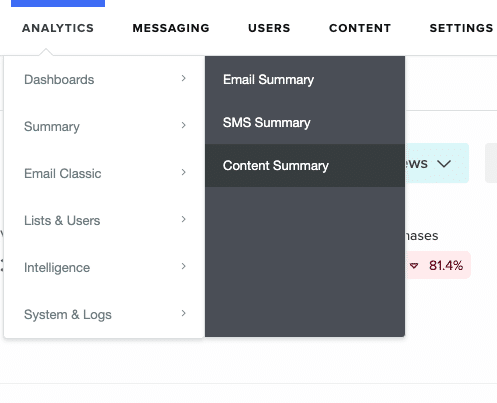
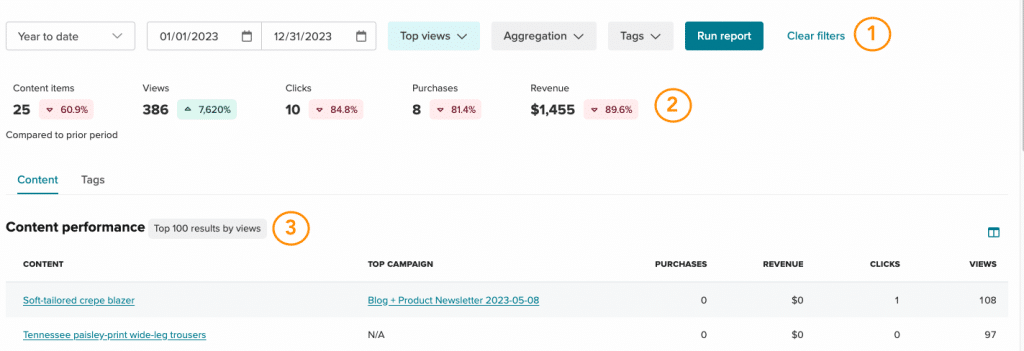
The report is broken up into three main sections.
- Filters
- Headline and comparison metrics
- Tables
 Note: Reporting is about 6 hours lagged from real-time. As data comes in, it is updated continuously.
Filter data
The Filter options available for Content Summary allow you to change the date ranges that the reporting pulls from, change what metric you would like to view the top performing results by, and filter by tags. You can also apply an aggregation which displays the single highest performing result per aggregation period, such as every week for the previous month.
Run report
On page load the report will run automatically. Select the Run report button when you make changes to the filters. The report needs to re-run for any changes to affect the data displayed in the tables, headline and comparison metrics.Report last ran
The timestamp "Report last ran # minutes ago" will display how long ago the last report was run, up to 30 minutes. After 30 minutes the timestamp will read as "Report last ran over 30 minutes ago".Filters in the URL
The filters of the last run report are appended to the URL, for example https://my.sailthru.com/content_summary?preset=month_to_date&resultsBy=views. We recommend bookmarking your favorite Content Summary reports to easily return to weekly, monthly, and all year around.Date range
Select from a range of preset dates ranges, or use the date picker to select your own custom date range. The preset 'Month to date' is selected by default.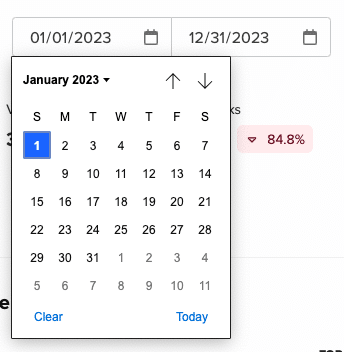
Top content and tag results
Select the metric that you would like the top performing results to be measured by, from views, clicks, purchases and revenue. The metric 'views' is selected by default.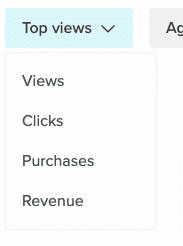
Aggregation
Select an aggregation if you would like to see the top performing result at a regular cadence through the selected date range, by hour, day, week, month, or year.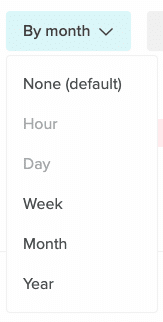
The selected date range will impact the aggregations that can be selected.
Aggregate Data
To aggregate data in the content table:- Select your aggregation type from the dropdown menu, for example Week.
- Click Run report. The report will reload with your aggregation selection applied.
- To remove any aggregation, select None (default) from the dropdown menu and re-run the report.
After you aggregate your data, those columns change. Using By week aggregation as an example, you'll see a new Week Beginning column before the Top Content.
Tags
Select tags to filter content and tag results. Filtering by tag will impact the tables, headline and comparison metrics.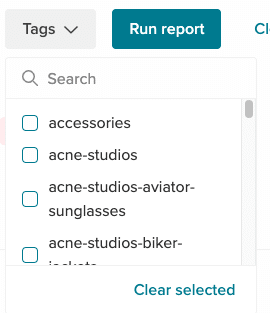
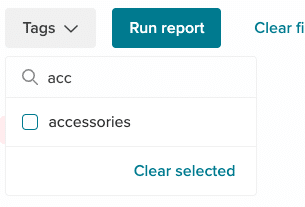
Type the tag into the search box and tick the box next to the tag(s) with which you would like to filter the results. Partial text searches are supported.
The first 100 tags by alphabetical order will display inside the Tags filter. Scroll to the bottom of the tag list and select 'Load more' to display the next 100 tags.
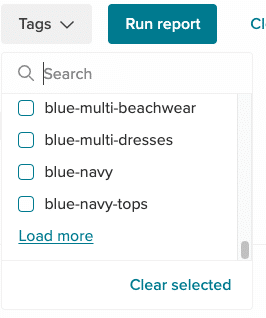
We recommend typing to search for the desired tags. Select your tags and close the Tag filter. The number of selected tags shows in the filter.
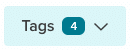
View the selected tags at the top of the tag list by clicking on the Tag filter.
Clear filters
After the filters have been adjusted a Clear filters button displays. Select Clear filters if you would like to return the filters to their default state:- Date range will be set to Month to date.
- Top metric will be set to Top views.
- Aggregation will be set to None (default).
- Tag filter will deselect any selected tags.
Headline and comparison metrics
The headline and comparison metrics section provides numerical data of your content performance within the date range, and percentage data comparing how your content performed in the period prior to the selected date range. For example in July 2023 the date range 'Previous month' will display numerical data of your content performed in June 2023, and the percentage data will compare how your content performed in June 2023 with how it performed in May 2023. Current day, Week to date, Month to date, and Year to date will compare against the previous complete date range respectively. Note: The date range and tag filters will affect the content that is included within these metrics.Content items
Number of items in the content library that had engagement, by views, clicks, or purchases.Views
Total number of views of the content.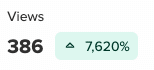
Clicks
Total number of clicks on content from campaigns.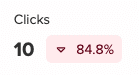
Purchases
The total quantity of content items purchased.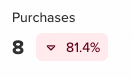
Revenue
The total revenue the content items have generated.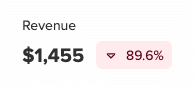
Tables
The tables section contains two tables that provide data of your top performing content and top performing tags. Access the tables by selecting the Content or Tags tab displayed below the headline and comparison metrics.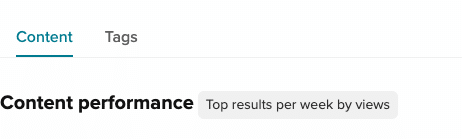
Data selector
The data selector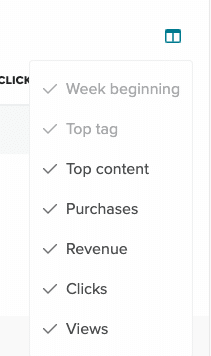
The available data options vary between the Content performance and Tag performance tables. The options also vary when viewing aggregated data.
Content performance
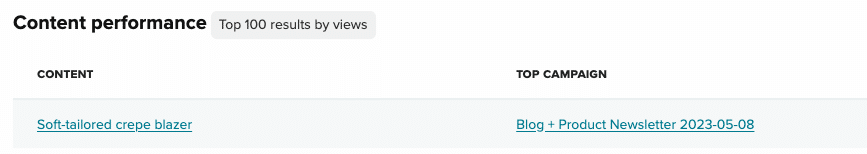
The Content performance table provides data for the top 100 performing content items based on the selected measurement metric, such as views, clicks, purchases, and revenue.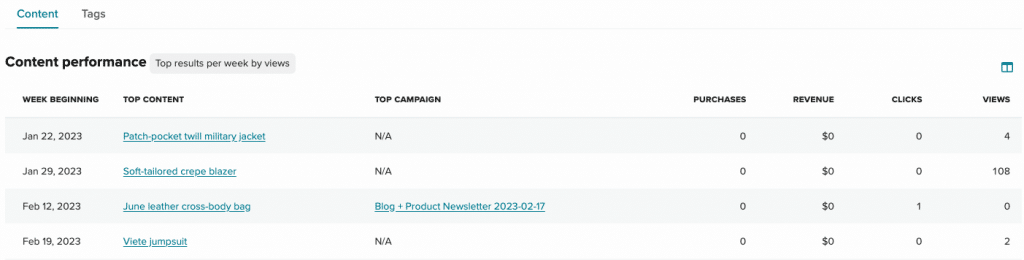 When a Tag filter is selected the Content performance table only provides the top performing content items that are associated with the tags selected.
When you aggregate data the Content performance table provides the top performing content item per aggregation, such as the top performer every month for the previous year.
The tag next to the table header provides context for the table data.
When a Tag filter is selected the Content performance table only provides the top performing content items that are associated with the tags selected.
When you aggregate data the Content performance table provides the top performing content item per aggregation, such as the top performer every month for the previous year.
The tag next to the table header provides context for the table data.
Date
This column shows the date and time for each aggregation within the date range. Includes hour beginning, day, week beginning, month, and year.
Note: Only displays when an aggregation is selected.
Top content
The name of the highest performing content item within the aggregation based on the metric that you have selected to measure them by. Will display the URL of the content item if the name is missing, as will happen if the content item has been deleted. Clicking on the name of the top content will redirect you to the content item in the content library. Note: Only displays when an aggregation is selected.Content
The names of the top 100 performing content items based on the metric that you have selected to measure them by. Will display the URL of the content item if the name is missing, as will happen if the content item has been deleted. Clicking on the name of the content will redirect you to the content item in the content library.Top campaign
The campaign that performed the highest for the content item based on the metric that you have selected to measure them by. Clicking on the name of the top campaign will redirect you to the campaign in campaign summary.Purchases
The total quantity of the content item purchased.Revenue
The total revenue the content item has generated.Clicks
The number of times the content was clicked in all campaigns.Views
The number of times the content was viewed.Tag performance
The Tag performance table provides a sum of the data for the content associated with each of the top ten performing tags based on the metric that you have selected to measure the content by, such as views, clicks, purchases, and revenue.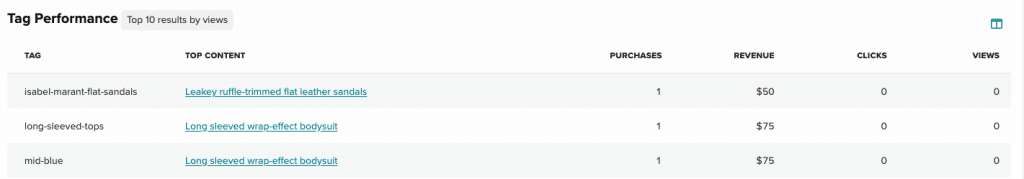
When a tag filter is selected the Tag performance table will provide the top performing tag at the top of the table, followed by the nine highest performing tags that are also associated with the content items that are associated with the selected tags. When data is aggregated the Tag performance table provides the top performing tag per aggregation, such as the top performer every month for the previous year. The tag next to the table header will provide context for the data the table is displaying.
Date
The date and time for each aggregation within the date range. Includes hour beginning, day, week beginning, month, and year. Note: Only displays when an aggregation is selected.