Realtime Dashboard
The Realtime Dashboard displays graphs of your site’s daily and hourly pageview and commerce activity for today or any selected date. The graph is overlaid with your campaign activity, giving you a high-level view of content performance that you can correlate with your campaigns.
Note: Pageview activity requires the JavaScript tag on your site, and revenue/order data is only shown for e-commerce clients who sync purchase data. You will not see activity for any page that does not have the JavaScript tag.The Primary Graph
Use the date buttons at the top-right to change the time period for all graphs on the page: Today, Yesterday, or a Specific Date.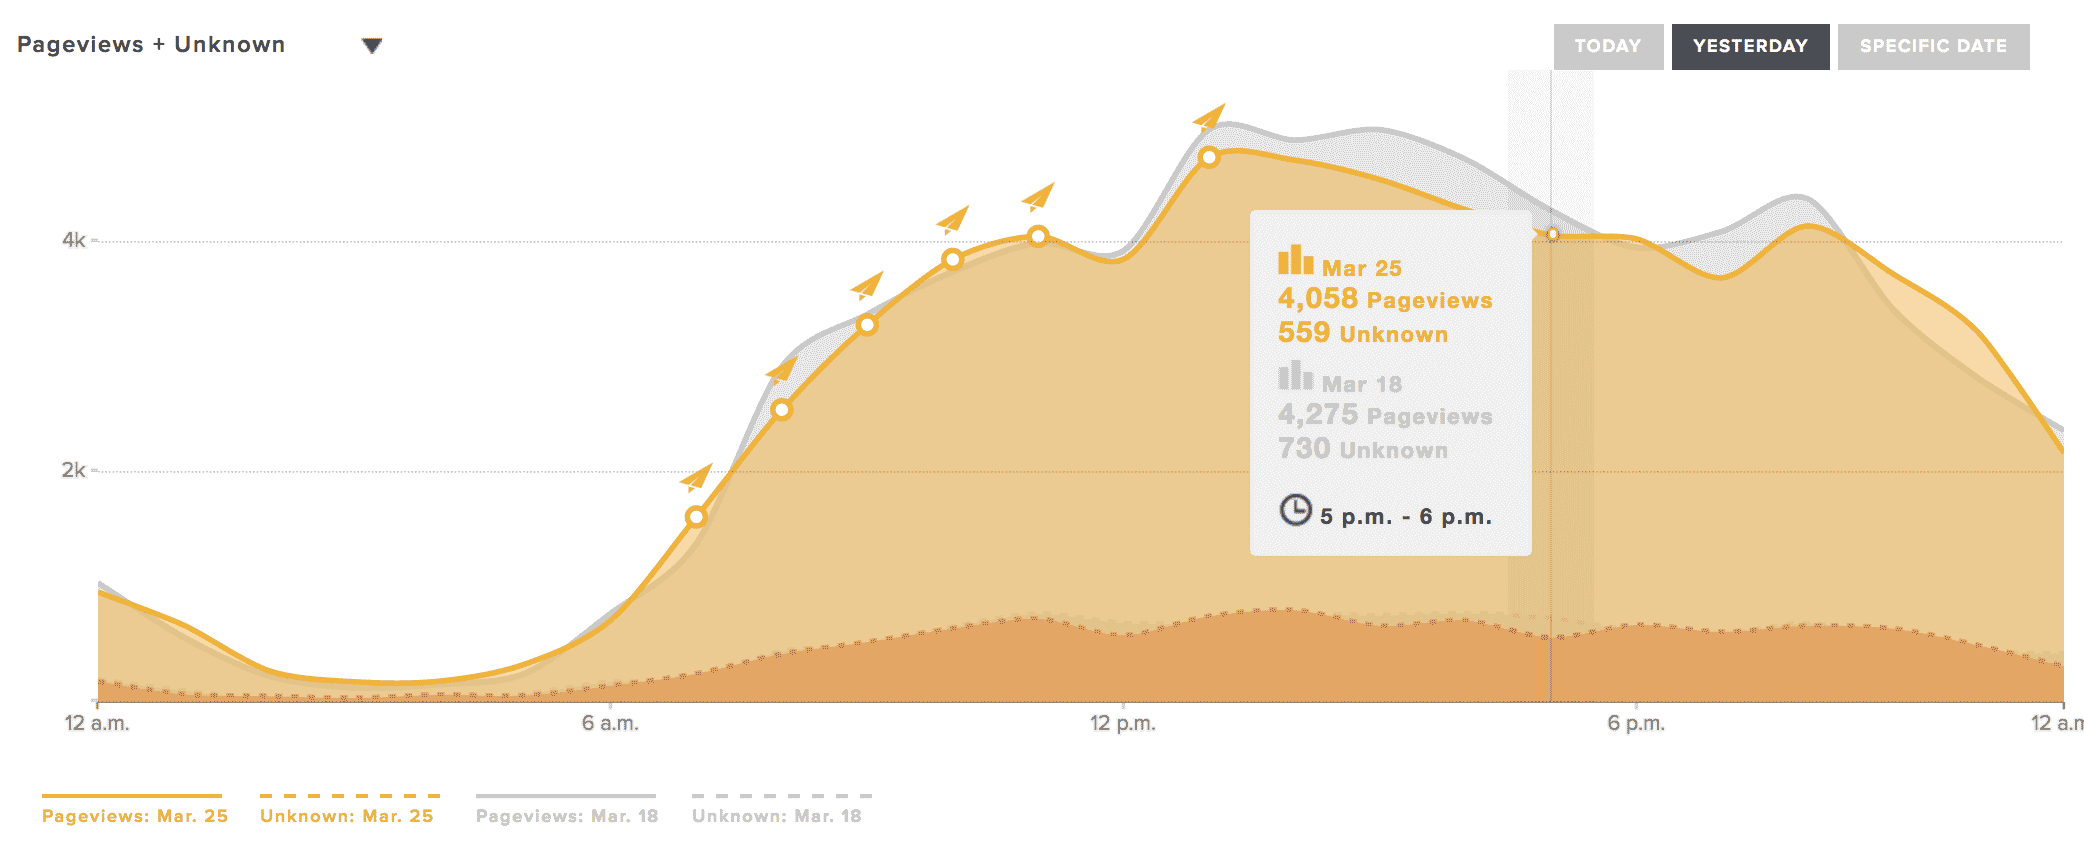
- For the selected date, the primary graph at the top of the page displays
- The metric selected from the drop-down (top-left)
- A gray overlay of data from 7 days prior, allowing you to compare against the previous week.
- Campaign sends, plotted with the paper airplane icon

- For detailed metrics for a given hour within the day’s data, hover over any corresponding part of the graph.
- For the names of the campaigns on the graph, hover over their icons.
- For details about each metric from the graph’s menu, see Realtime Dashboard Analytics Glossary, below.
Additional Graphs
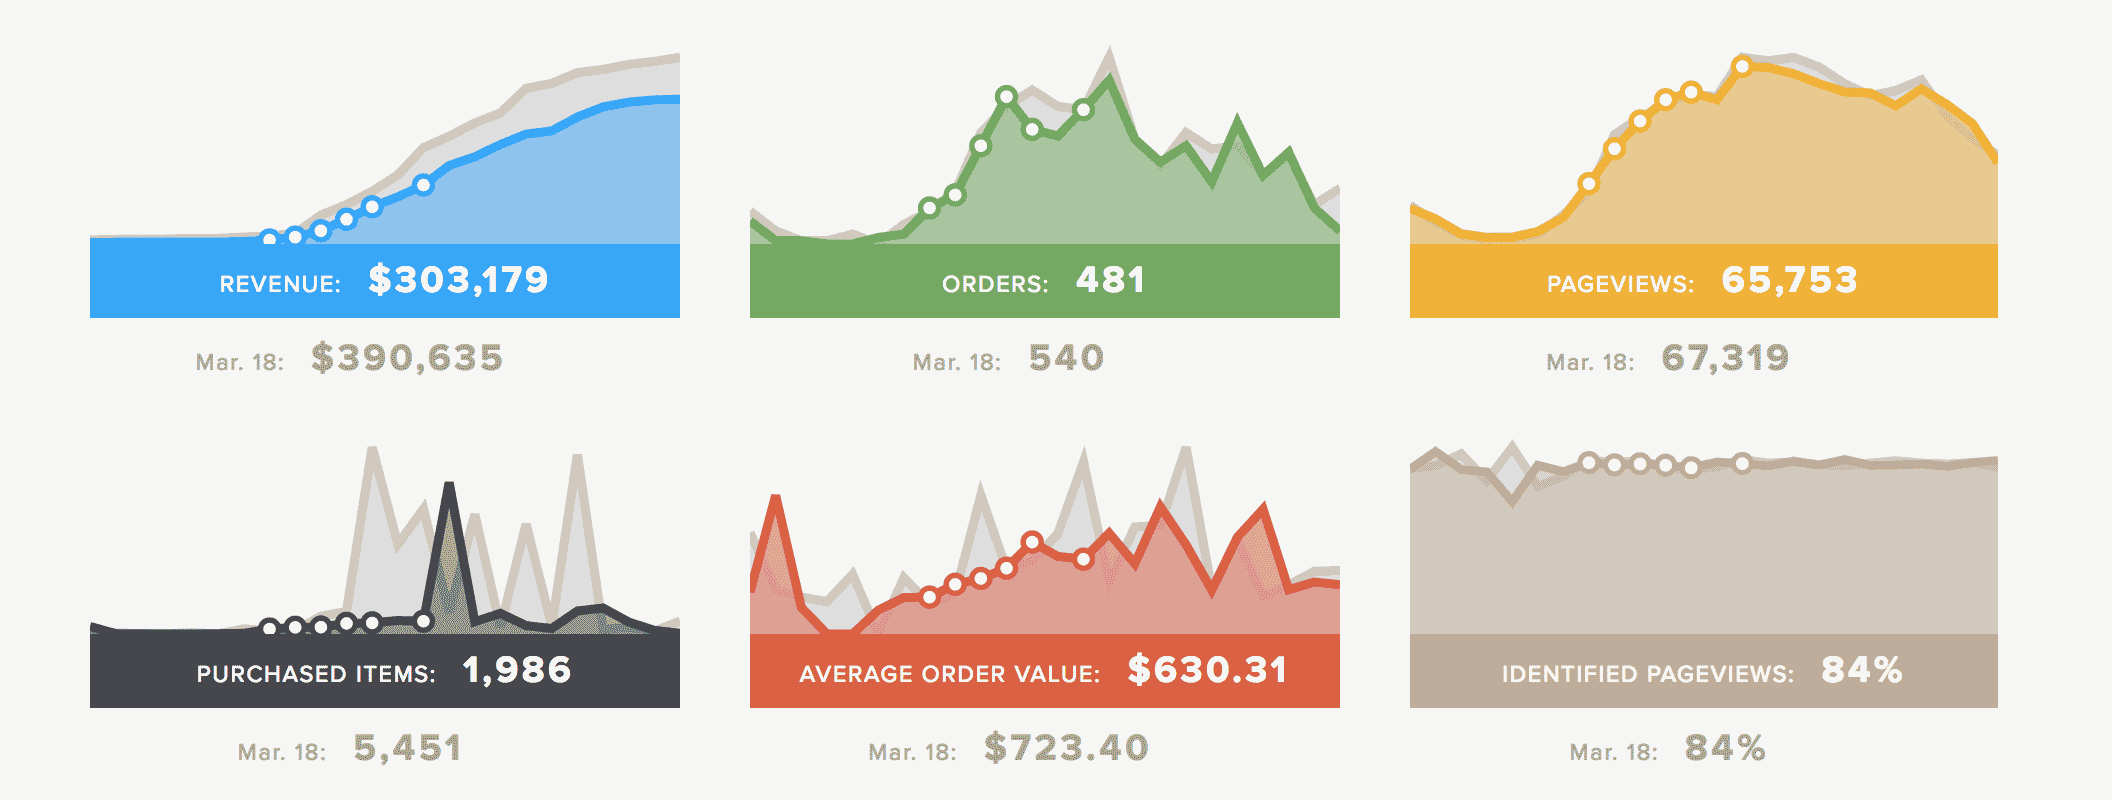
Below the primary graph, you’ll find additional graphs that display:
- The selected date’s Pageviews and Identified Pageviews. Identified Pageviews are percentage of your pageviews that are attributed to your known users–those with existing user profiles. For each metric, the accompanying figure for 7 days prior is shown below.
- If you are an e-commerce company syncing purchase data, data is also displayed for Revenue, Orders, Purchased Items, and Average Order Value. For each metric, the accompanying figure for 7 days prior is shown below.
- You can hover your mouse over each graph for more information about each hour’s metrics and each displayed campaign.
- For details about each metric, see Realtime Dashboard Analytics Glossary below.
Top Pageviews and Top Revenue Lists
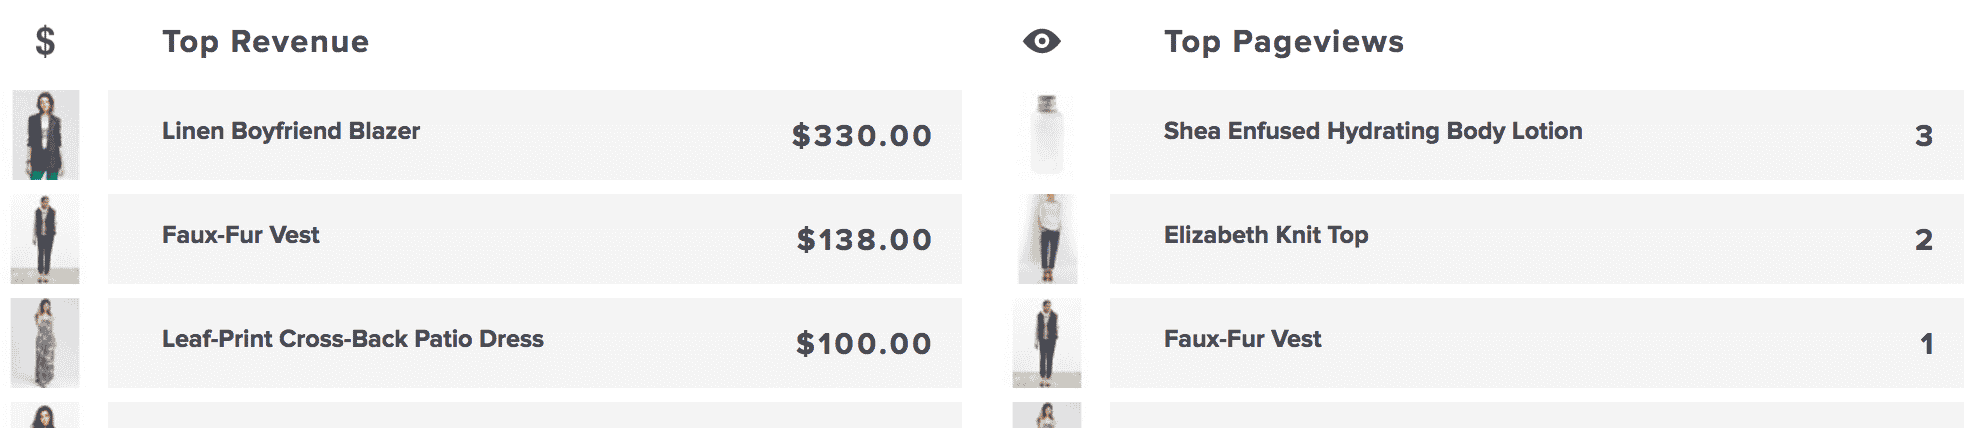
At the bottom of the page, you will see a Top Pageviews list, and, if your account is configured for e-commerce, you will also see a Top Revenue list. For the day selected at the top of the page, each list displays your top 10 content items (pages) in terms of attributed revenue or pageviews.
Realtime Dashboard Analytics Glossary
|
Name |
Description |
|
Revenue* |
Total cumulative revenue for the day (as of the current or selected hour of the day, if any). |
|
Orders* |
Total orders placed on the selected day or within the selected hour of the day. |
|
Purchased Items* |
Total purchased items on the selected day or within the selected hour of the day. |
|
Pageviews |
The total number of times that pages from your site were visited in the selected time period. |
|
Pageviews + Unknown |
Pageviews graphed with an additional dotted-line overlay representing the number of those pageviews attributed to “unknown” users-those not identified as having an existing user profile on your account. |
|
Unknown |
Visits to unknown or unspecified pages on a site. |
|
Identified Pageviews |
The percentage of pageviews that are from known users, those identified as having an existing user profile on your account. |
|
AOV |
Average Order Value. Calculated by the total purchase revenue over the total number of purchases. Note, this does not include ad revenue. |
*This data is dependent on proper integration with the Purchase API.