Push and In-App Summary
Contents
Understand customer engagement with your Push and In-App campaigns with Push/ In-App Summary.
The Report
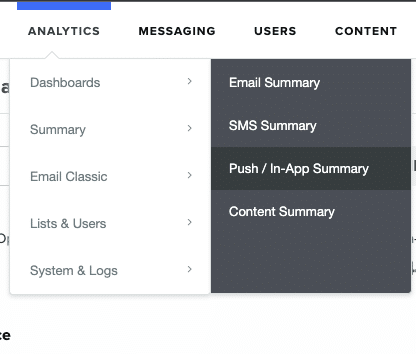
View aggregate data of your content and tag performance. Locate the Push/In-App Summary in the Analytics menu, under Summary.
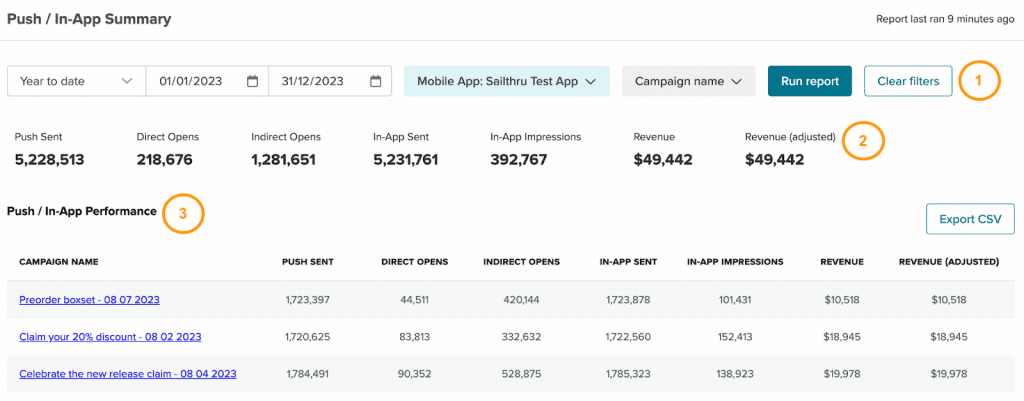
The report is broken up into three main sections:
- Filters
- Headline metrics
- Performance table
Note: Reporting is close to real-time. Data is updated continuously. To see updates reflected in the UI, select Run Report.
Filter data
Filter summary data by date range or specific dates, the campaign name, and the app.

Run report
On page load the report will run automatically. Select the Run report button when you make changes to the filters. The report needs to re-run for any changes to affect the data displayed in the tables, headline and comparison metrics.
Report last ran
The timestamp "Report last ran # minutes ago" will display how long ago the last report was run, up to 30 minutes. After 30 minutes the timestamp will read as "Report last ran over 30 minutes ago".
Filters in the URL
The filters of the last run report are appended to the URL, for example <span style="font-weight: 400;">https://my.sailthru.com/mobile_summary?preset=month-to-date&app_id=<app id></span>.
We recommend bookmarking your favorite reports to easily return to weekly, monthly, and all year around.
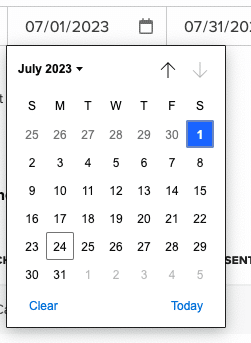
Date range
Select from a range of preset dates ranges, or use the date picker to select your own custom date range. The preset 'Month to date' is selected by default.
App Selector
Select an app to see metrics for the push and in-app messages related to it. You can only select one app at a time. If you only have one app, it will be selected by default.
Campaign Name
Select one or more campaign names to display metrics for those specific sends.
Clear filters
After the filters have been adjusted a Clear filters button displays. Select Clear filters if you would like to return the filters to their default state:
- Date range will be set to Month to date.
- Any Campaign Name filters will be deselected.
- The App resets to the first in the list.
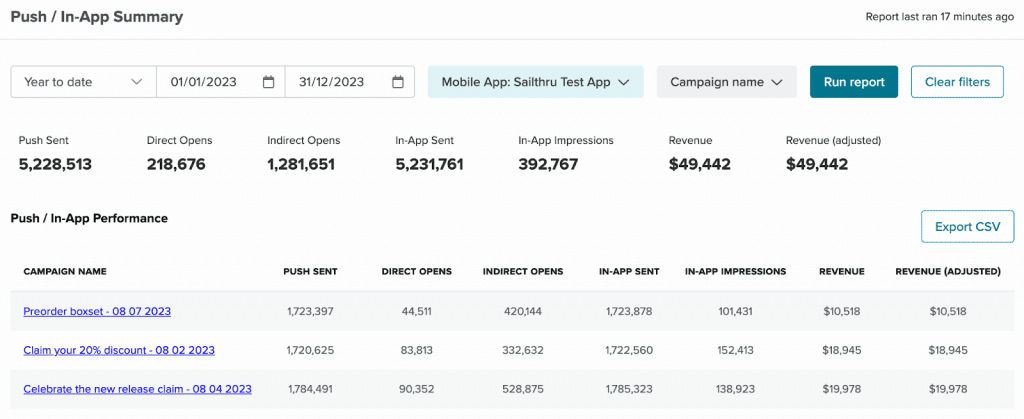
Headline Metrics
This section includes numerical data for your sends over a specified time range. By default, you will see the number of pushes sent, the direct opens, indirect opens, in-app messages sent, in-app impressions, revenue, and the adjusted revenue for a one month period. For more information on these metrics, see the Push/In-App Summary Metrics section.

For example in July 2023 the date range 'Previous month' will display numerical data for your sends in June 2023.
Push/In-App Performance Table
The data for each Push/In-App campaign sent during your selected date range is displayed in the Push/In-App Performance Table. Select the campaign name to be taken to the campaign workflow.
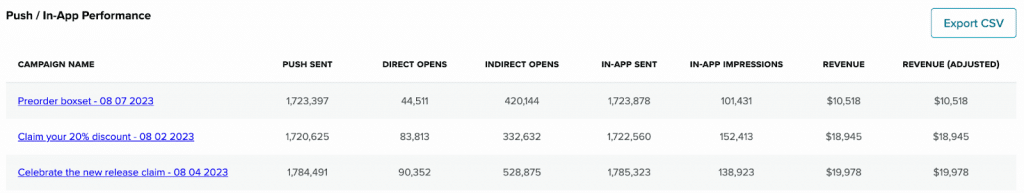
For more information on the metrics included in the table, see the Push/In-App Summary Metrics section.
Export Data
Select the Export CSV button to automatically download a CSV file. The file includes additional information, like each campaign's blast ID and the app ID.
Push/In-App Summary Metrics
Name | Description |
Channel | Currently only provides metrics for campaign sends. |
Push Sent | The volume of pushes sent over a period of time. |
Direct Opens | The number of opens that occurred as a result of tapping a notification if the app is not already open. |
Indirect Opens | The number of opens that occurred as a result of seeing the notification (for example, people who saw a notification and opened the app from the app drawer or home screen). |
In-App Sent | The number of In-App messages sent. |
In-App Impressions | The number of users who viewed the In-App message either as a notification, in the message stream, or as a full screen message. |
Revenue | The revenue associated with a campaign. |
Revenue (Adjusted) | Any revenue adjustments for shipping, discounts, tax, and/or any custom adjustments. |