A/B Testing in Overlays
Contents
Compare variations of your overlay design, overlay copy, targeting parameters, and overlay type with A/B testing. Experiment and optimize for conversion to find the message or overlay design that resonates best with your site visitors. Get easy-to-read results after several days' worth of data plotted over time to see how conversion is trending. Make a decision after you've reviewed the data to create a new winning variant that will be on your site going forward!
Overview
Before you start creating a set of overlays to test, take some time to decide which elements you're testing. You can test up to 5 variations simultaneously in 1 test. You can vary the traffic split, with a minimum split of 5% of traffic to a variation.Tips and Best Practices
- Be sure to preview all variants while you're in draft mode.
- Work on the 'A' variant before creating variants. Variants are essentially clones of the prior variant, to help minimize the work to configure an overlay for testing.
- After concluding the test and selecting a winner, the platform will automatically create a copy of the variant for your use going forward.
Start Your Test
To start your testing:- Create a new overlay. Be sure to set up all the design details, and the Targeting details, to make it easier to create variations later on.
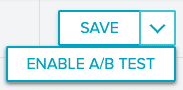
- Click the dropdown arrow on the Save button to show the menu. Select Enable A/B Test.
Note: Once this mode is enabled, it cannot be disabled. - Select Add Variant to manually add the number of variants you'd like to test. You can test two to five variants. By default, each test will include an A variant and a B variant. The B variant will have the same Style, Content, and Targeting configurations to begin with. We recommend modifying the Style and Content tabs, but leaving the Targeting setup to be the same across variants.

-
Assign a percentage of your total users to each variant.

- Adjust the design, messaging, or content of your overlays and save your work.
- When you're ready to launch your overlays experiment, click Status in the Top Bar. By default, this is set to Draft.
Note: When designing an A/B test, you can only make changes while it is in Draft status. Once it is active, you cannot change the status or edit the overlay because any changes to an active A/B test will affect your statistics.
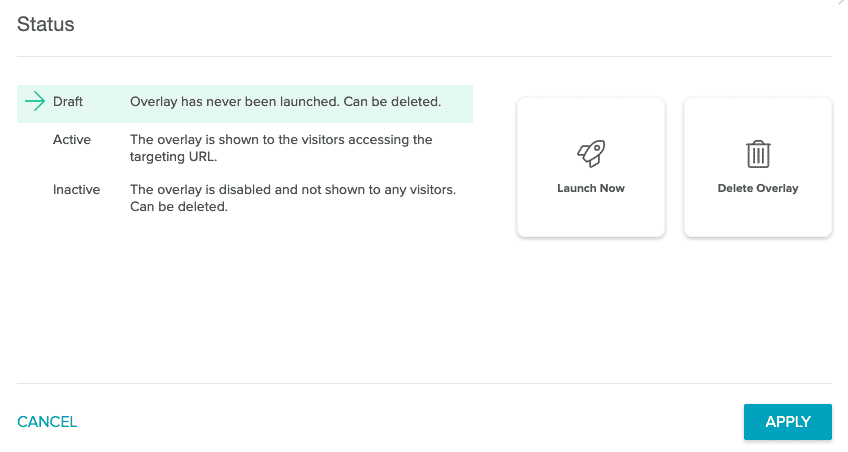
- Select Launch Now to move your overlays to Active and click Apply.
Copy a Test
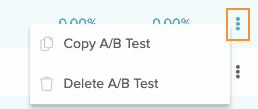
Make a copy of your overlay from the Overlays List page. Hover over the three vertical dots ![]() at the right side of the list page entry. Depending on the status of your overlay, you'll see different options.
at the right side of the list page entry. Depending on the status of your overlay, you'll see different options.
If your overlay's status is Draft or Inactive, you'll be able to copy or delete the A/B test:
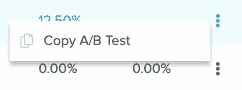
If your overlay's status is Active, you'll only be able to copy the test:
While the Test is Running
As the test is running, metrics are being collected for each variant. For the first 24 hours, the analytics view will be unavailable as the service is collecting data.
During the test run, data will populate in the charting. There is no time limit for how long the experiment can run.
While data is being collected, you should expect the following:
- Variants cannot be edited after the experiment is activated. We've designed this behavior deliberately to ensure the integrity of the experiment design and statistical analysis.
- Try to avoid making a decision on which variant you want to choose before 7 days of data have been collected. We have seen experiments where prior to the 7-day-mark, that conversion may fluctuate and create scenarios where a variant should not be called the winner.
- If you need to stop the experiment early, you can do so through the Editor.
Reading your Test Results
Our primary concern when building AB testing was to make it simple to use for non-statisticians, while providing the same level of robustness to make decisions confidently. These requirements led us to Bayesian methods that don't rely on reaching hard-to-interpret statistical significance, or having to define a sample size. Our method instead is guided by a more business-centric approach of minimizing the risk of making a big mistake and getting robust answers quickly.
The method uses Bayesian statistics to build a probability distribution (the shaded bands around the Conversion Rate charting) of the conversion rate over each day. As we gather more evidence the distribution becomes narrower around the true value and allows us to be more confident in our decision making. The point at which the system calls a winner is when the risk of making a wrong decision is minimal. This risk involves not only the probability of choosing a losing variant, but also the size of the mistake--i.e. we might be willing to tolerate a variant that is actually 0.1% below the winner if that means we can act sooner.
Bayesian inference provides the optimal way to incorporate new evidence and data as it arrives, reaching conclusions faster.
The analytics page is composed of three parts:
- The Summary (nicknamed the 'tl;dr')
- The Table
- The Charts
The Page Summary
- This part of the page displays a summary of the experiment status and the winning variant if one can be selected.
- The experiment might be either 'Ongoing' or 'Stopped'.
- If a winner can be declared, we'll mention the specific variant.
- If a winner cannot be declared, the reason will be provided.
The Page Table
A summary of the experiment metrics are noted here.
- Variant - The label that's automatically assigned to the overlay variant.
- Checkmark Icon - An icon that designates the winning variant in the experiment group. The winner is chosen given the inference calculations and whether its probability to beat all other variants is more than 95%, the probability of loss of conversions is well under 10%, the experiment has run for 7 days continuously and has at least 1,000 views.
- Allocation - The percentage of traffic allocated to that variant.
- Views - The number of times the overlay was displayed to a user.
- Conversion Rate - The number of clicks or sign ups (depending on the Overlay Goal) divided by the views.
- Lift - The relative increase of conversion rate compared to the other variants' rates.
The Page Charts
- An illustration of the metrics collected day-by-day.
- The Views chart illustrates the number of views each Overlay variant received for a given day.
- The Conversion Rate chart illustrates the ongoing conversion rate inference calculation that is calculated each day. The calculation is cumulative, meaning that all evidence accumulated up to that point is used. The banding illustrates the 90% credible interval of the conversion rate. Its limits can be thought of as the least- and most-optimistic cases.
Concluding your Test
When you've allowed your test variations to run for at least seven days and have collected enough data, it's time to conclude your test and analyze results. If your results aren't conclusive, you will need to let your test run longer.
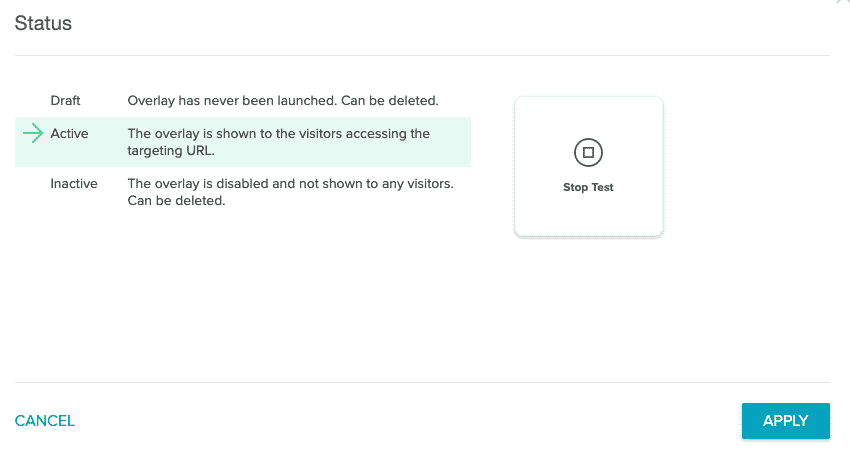
Complete a Test
To complete your test, select the Status in the Top Bar ![]() . This will open the Status modal. Select Stop Test and click Apply. This will complete your Overlay test and it will no longer be served on your site.
. This will open the Status modal. Select Stop Test and click Apply. This will complete your Overlay test and it will no longer be served on your site.
In the best-case scenario, by the end of seven days (or your selected test period) you'll have a winning variant of your test. You can then make changes based on the results or iterate on your testing.
That iteration may take different paths. For example, you may choose a variant to generate a new Overlays experiment. Or, you might just serve the winning Overlay variant without further testing. There is also the option of running the test again, to observe whether the winning variation's results are durable and consistent compared to the same set of variations as before.
Inconclusive Tests
If it's been seven days and your test is inconclusive, you'll see a reason for it. You can take some actions based on the reason your test is inconclusive.
- Allow your test to run longer. You may need to show the test variants to a larger pool of users and/or for a longer time period.
- Check to see if you're experiencing results which converge. If you are, the variations may not be unique enough, and it may be worthwhile to iterate upon your designs and run more tests.
New Features to Manage your Overlays in the Overlay List
Coming soon - you can copy experiments and individual variants to easily spin up the Overlays you need.
Frequently Asked Questions
- What happens when I have two experiments running? Am I shown two variants from two experiments? What is the priority setup?
- Experiments are not designed to conflict with each other or override one another, since our features are set up to bucket a visitor for the purposes of displaying 1 variant among several within the experiment. That is, a site visitor could conceivably be in The priority configuration of Overlays are then layered on, to establish which Overlay for a given set of targeting parameters would then be shown to the user. For the easiest-to-understand results that might be referenced later, we recommend that you isolate Overlays A/B tests to targeting setups where there's no other Overlays that would be candidates for a site visitor to see.
- Can you adjust percentages after the experiment has launched?
- Not at the moment.
-
Can you export the metrics?
- Not at the moment.
-
Can you set a target for the traffic, before automatically ending the experiment?
- No, and it is better practice to monitor your A/B tests as they run. We display data after 24 hours have lapsed, and we recommend that you run the experiment for at least 1 week.
-
Can you mix and match testing of modals and sticky banners?
- Not at the moment.
-
Which variant is the control? Can I change this?
- For the purposes of calculating lift and reflecting the nuances of our model, we calculate all permutations of the experiment where every variant is treated as the control. We don't allow you to configure which variant is treated as the control for the purposes of viewing the different permutations. We automatically select the next-best (by virtue of the median conversion rate observed for a variant) variant for the purposes of declaring a winner.
-
What do the zero values mean in the Views chart, on the analytics view?
- Assuming that the experiment is active, in some cases, when the Targeting parameters have been set up with an invalid or infrequently-visited page, then it is possible that no views are being generated by site visitors. If this happens, we recommend tuning your targeting parameters more loosely.