App Analytics
Contents
App Analytics offer deep insight into how and where your audience is using your app.
For your selected metrics and time periods, view interactive graphs and data, or download data as a CSV file.
For information about other analytics data and export methods available, or about using the analytics graph options and flags, see Introduction to Mobile Analytics. To access the analytics listed on this page, select your app in the Mobile interface, then select Analytics.Engagement
Use the tabs at the top to view App Opens, Monthly Active Users, Time In App, or Events.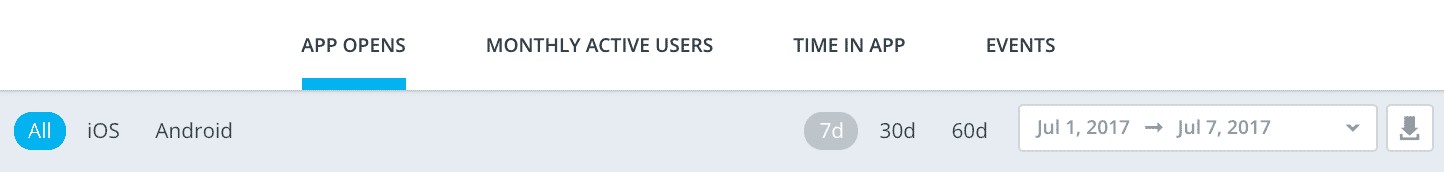
App Opens
The App Opens tab shows the frequency with which your users are opening your app. An open is recorded each time a user opens your app, so an individual user many be responsible for many opens across any given time period. Opens is a key metric for success in determining the extent to which your audience is using the app.
The metrics displayed below the graph are
- Opens - the number of times the app has been opened by the selected users (iOS, Android, or All) across the selected date range.
- Average Opens - the number of times the app has been opened by the selected users per day (based on the date range selected)
- Total Opens (All Time) - The total number of opens since you integrated your app with Mobile, not limited by the selected date range.
Monthly Active Users
The Monthly Active Users tab shows the number of users who regularly engage with your app; specifically, for any given date, how many users opened your app in the 30 days preceding that date. This number is a good indication of the overall success of your app; active users are engaged users.
The metrics displayed below the graph are:
- Min Monthly Active Users - the smallest number of monthly active users for any date in the selected range.
- Average Monthly Active Users - the average number of monthly active users for any date in the selected range.
- Max Monthly Active Users - the largest number of monthly active users for any date in the selected range.
Time in App
The Time In App tab shows the amounts of time collectively spent by your users in your app each day and across the selected time period. On the graph, the vertical axis shows the number of seconds spent by all users in the app for the given day. When you hover over a day's data point, larger time spans will be displayed in terms of months and days, rather than seconds.The metrics displayed below the graph are:
- Session Time - The total amount of time spent by all users in your app, in aggregate, across the selected date range.
- Average Session Time - The average amount of time per day spent by all users in your app, in aggregate, across the selected date range.
- Total Session Time (All Time) - The total amount of time spent by all users in your app since you integrated your app with Mobile, not limited by the selected date range.
Events
The events tab allows you to view notable actions your users have taken, including events:- Logged natively with Mobile at the SDK level.
- Passed to Mobile via the Mobile users API events call.
- Or events captured through auto analytics integration.
Revenue
The Revenue tab allows you to track revenue attributed to mobile messages for any specified time period, post January 1, 2020. Visualize trends and analyze the performance of mobile marketing over time.
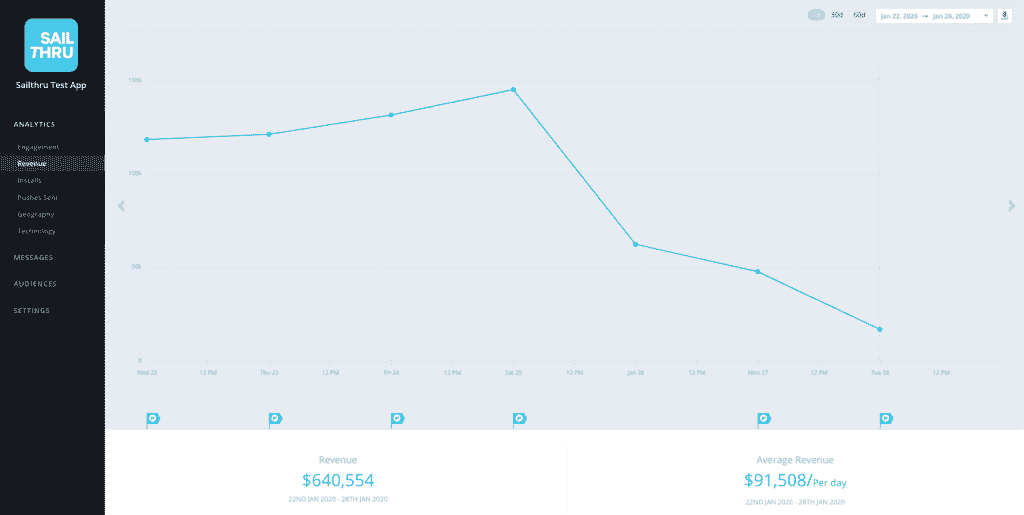
You can also export your data as a CSV file. Choose one of the existing time ranges, or use the date selector to select the date range you wish to export. Click the download button ![]() to download your file.
to download your file.
Installs
The Installs tab allows you to track how many users are installing your app over time.
- The Installs and Average Installs metrics apply to your selected date range.
- The Total Installs (All Time) metric in the lower right corner indicates the total number of installs your app has had since you first integrated the app with Carnival.
Note: Each install is counted when the app is run for the first time on the device.
The Uninstalls tab indicates users that have removed the app from their device.
Mobile offers an Uninstalls API that allows you to see the specific devices for which users have uninstalled. This allows you to retarget users via other marketing channels other than the device on which they have performed the uninstall.
- The Uninstalls and Average Uninstalls metrics apply to your selected date range.
- The Total Uninstalls (All Time) metric in the lower right corner indicates the total number of uninstalls your app has had since you first integrated the app with Mobile.
Pushes Sent
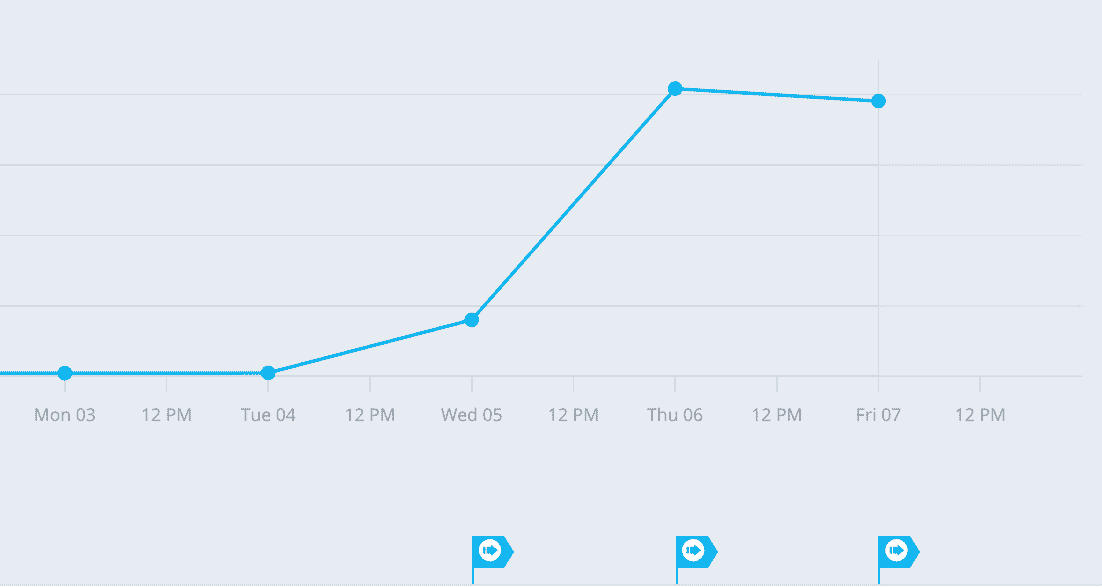
Pushes Sent allows you to monitor the volume of push notifications sent over a period of time. The number of pushes sent is the total for all users. For example, if you have 100,000 users and sent a single push notification to all users this week, your volume for the week (and for that day, specifically) would be 100,000. This data is useful for comparing how mass notifications impact app opens.
The pushes sent graph shows notifications sent via API. If you send all messaging through our Notifications API (for breaking news alerts, for example), message flags will not appear.
To view the text of the push notifications for any given date, click the flag icon that corresponds to that date.
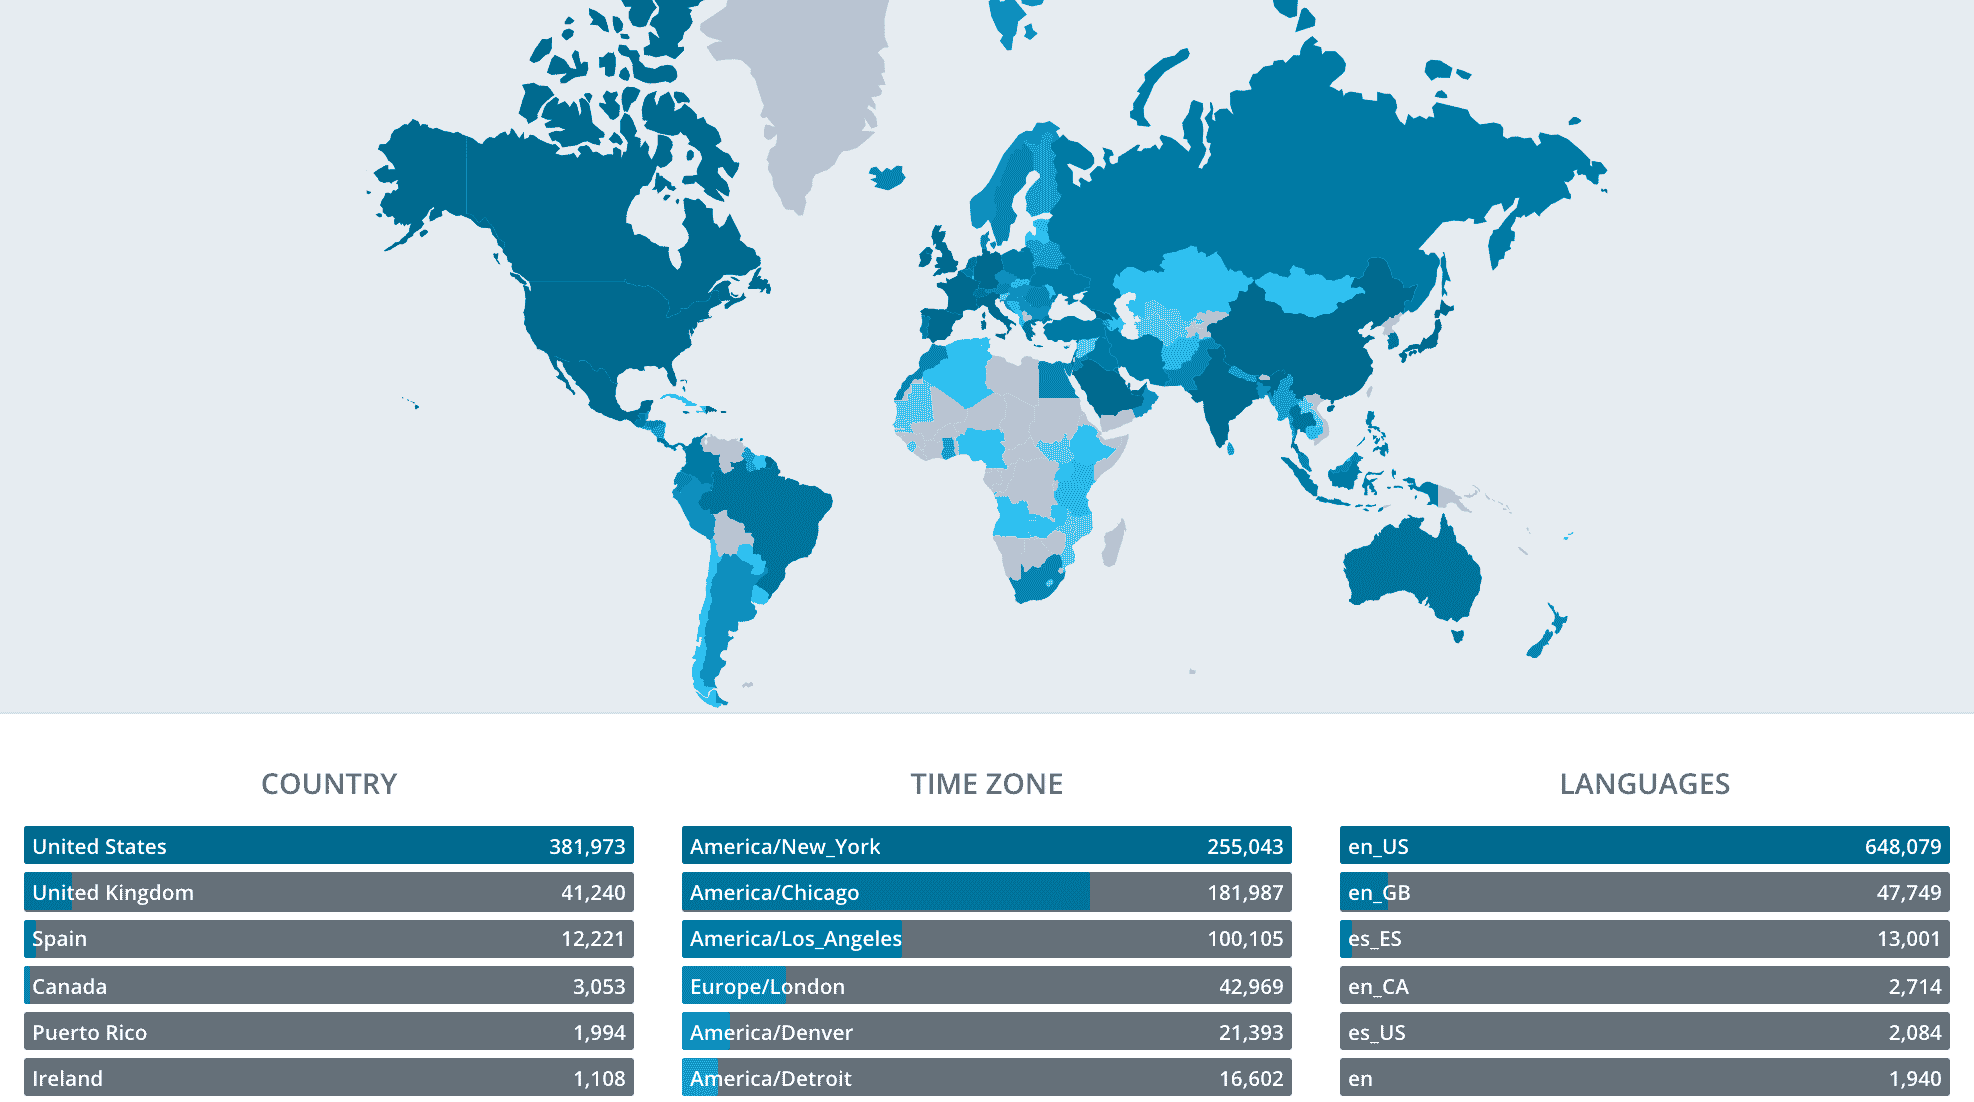
Geography
The Geography interface allows you to view the geographic locations of your audience. The lists at the bottom of the page showcase the top languages, countries, and time zones of your users. Marketers can use this information to ensure that apps and messages are relevant to the language and location of their audience.
Location information for users is drawn either from the IP address of their device or from their device's reported GPS location information, if they opt-in to provide this data and you are sending this data to Mobile. For further details on the methodology and guidance in obtaining and using geographic information, see Using Location Tracking.
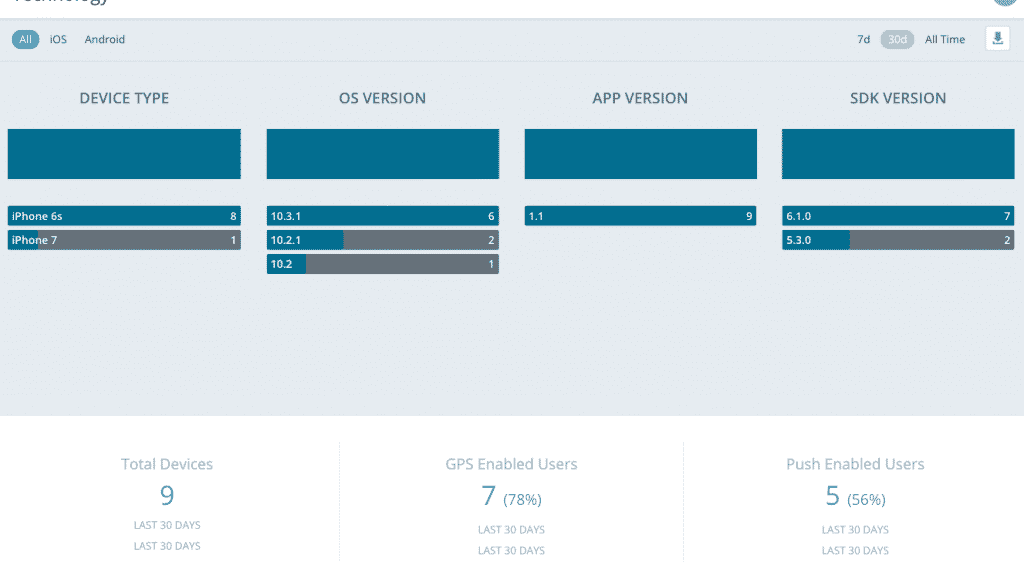
Technology
The Technology tab contains the device hardware and software breakdown of your users. This data provides insight such as::
- The number of users across different versions of your app.
- The number of users on older versions of the iOS or Android operating system.
- The types of devices (i.e. iPhone, iPad, iPod Touch, etc.) your users have.
- The number of users who have opted-in to push notifications, which can help to evaluate in-app messaging.
To understand how your users' technology changes over time, use the sub-tab buttons at the top of the screen. Developers can use system version data to inform programming techniques and app feature decisions.