Snapshot Reports
Contents
Snapshot Reports can be run from Audience Builder for any segment of users. You can segment users via the criteria available for Audience Builder.
How to Run a Snapshot Report
Go to the Audience Builder page.
- Ensure that the Snapshot Report button is selected.
- Select the List -- or multiple lists -- on which you'd like to run the report.
- Set the Criteria. For a full list of Criteria available in the dropdown, see the Audience Builder Criteria Glossary.
Snapshot Updates
While you're running your Snapshot Report, you'll see inline status updates and estimated user counts while the job runs. The estimated count is not your final count; it's the potential number of users who are being evaluated for inclusion.
Estimates save time when you're working with complex audience criteria or unknown custom fields and values. If you see an audience count that's larger or smaller than expected, you can return to Audience Builder immediately, without having to wait for the report to finish. Note: If you don't see updates, then your report ran too fast. You'll see updates if your report takes over a minute to run.
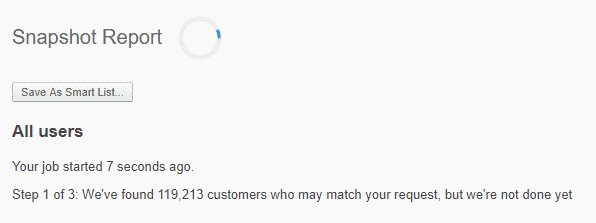
Step 1
When your job begins, you'll see a progress circle, a timestamp, and a count of the profiles who may match your criteria. This is not the final number of profiles, just the number the system is evaluating.
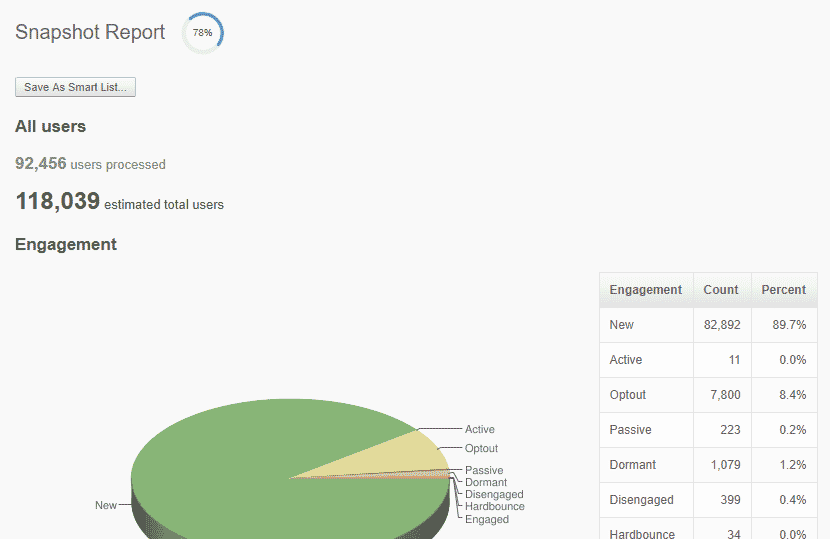
Step 2
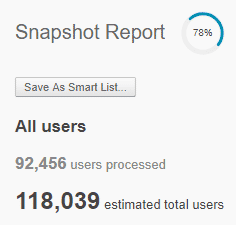
When audience information is ready to display, you'll see the data updating. It will tell you how many users have been processed, update the estimated total users, and show engagement counts.
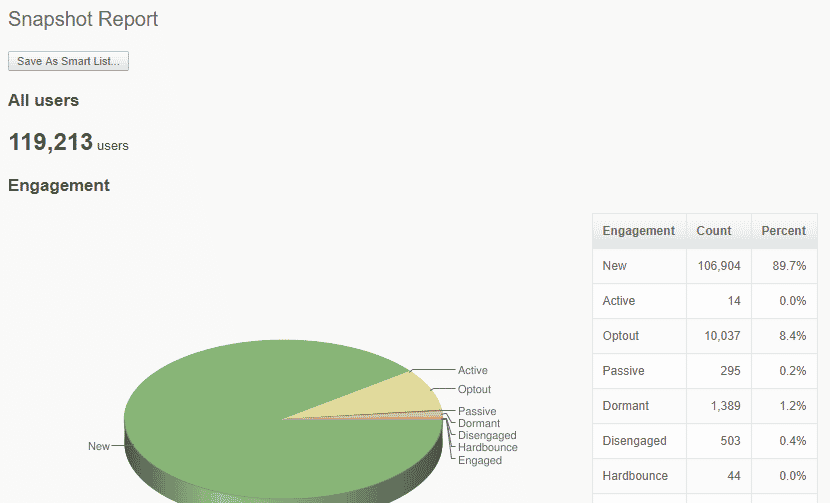
Step 3
When the "Estimated" count and progress circle disappear, the final audience count and engagement breakdown will be displayed.
Incremental user counts, engagement data, and progress information give you transparency into the Snapshot process, but don't expedite the processing time. They will allow you to make faster decisions about any changes you may need to make to your audience.
Note: This does not change the way users are evaluated for inclusion in an audience.Snapshot Report Sections
The table below describes the data found on snapshot reports. It's important to note that the data provided is determined by which criteria you have selected to segment users on the chosen list(s).
|
Report Section |
Description |
|---|---|
|
Engagement |
Shows segment by level of engagement, such as whether they are opening or clicking on emails. For detailed information, see User Engagement Levels. |
|
Geography |
Displays the geographic location information that is implicitly tracked, collected at the point of click. Top US states (if applicable), Countries and Cities are listed. |
|
Email Activity time |
Shows when users are opening their emails. The report shows the volume of opens by hour, allowing you to identify when open rates are higher or lower. Note that the activity here is broken out by hours based on the time zone in which your account was set up. |
|
Site Activity Time |
Displays the times when are users going on-site. This can be from the users clicking through and email and then browsing the site, or just their independent site behavior. Note that this requires Personalization Javascript to be enabled. |
|
Engagement by Signup Date |
Shows engagement based on signup month. |
|
Top Tags |
This represents the total number of pageviews this tag has generated from users on this list. This means that for each tag, the users from this segment of the list have driven the pageviews counted. 0% listed for your top interest indicates that the tag is too broad since interest scores are averaged. |
|
Top Items |
This represents the total number of users on this list who are marked as interested in the specific tag. The interest count represents the total numbers of users on the segment of the list for the report that show any interest in pages with this tag. |
|
Other Lists |
Other Natural Lists with subsets that overlap with List used for Snapshot Report query. The crossover or overlap between the list being queried in the report and Smart Lists is not shown in this report. |
|
Top Browser |
It is the top browsers and devices used for this user group (based on click-through). For example, this includes users who have opened an email on iPhone, Android, Internet Explorer, etc. |
|
Engagement by Domain Names |
This will list the top 20 domains. |